ATRでボラティリティ判定ツールの作成方法|チャートに×マークを描画する方法
1.トレンドラインのサンプルコードを流用
「ATRでボラティリティ判定ツールの作成方法|数値の表示方法や表示の色を変化させる方法」では、チャートの左下にATRの数値を表示し、チャートの四隅の時間情報と価格情報を定義することができました。続いて、トレンドラインを用いてチャートに×マークを描画していきます。
※この記事はMQL4の内容です。
トレンドラインのサンプルコードは、MQL4リファレンスからコピーして使いましょう。MQL4リファレンスの目次にある「Constants, Enumerations and Structures」→「Objects Constants」→「Object Types」をクリックするとオブジェクトの一覧が表示されるので、その中から「OBJ_TREND」を選択し、あらかじめ用意されている「Create a trend line by the given coordinates」のコードをコピーしてファイル下部に貼り付けます。
「//— set anchor points’ coordinates if they are not set」と「ChangeTrendEmptyPoints(time1,price1,time2,price2);」の2行を削除し、「Print(__FUNCTION__,」と「”: failed to create a trend line! Error code = “, GetLastError());」の2行は「/*」「*/」をつけてコメント扱いとします。そして、数値の変化が反映されるように「ObjectMove」を使います。「return(false);」の上に「ObjectMove(chart_ID, name, 0, time1, price1);」「ObjectMove(chart_ID, name, 1, time2, price2);」の2行を加えることで、時間情報と価格情報を同時に指定することができます。
また、初期値も2点変更しましょう。「// in the background」のところを「back = false」から「back = true」に、「// highlight to move」のところを「selection = true」から「selection = false」に変えます。
//+------------------------------------------------------------------+
//| Create a trend line by the given coordinates                     |
//+------------------------------------------------------------------+
bool TrendCreate(const long            chart_ID = 0,      // chart's ID
                 const string          name = "TrendLine", // line name
                 const int             sub_window = 0,    // subwindow index
                 datetime              time1 = 0,         // first point time
                 double                price1 = 0,        // first point price
                 datetime              time2 = 0,         // second point time
                 double                price2 = 0,        // second point price
                 const color           clr = clrRed,      // line color
                 const ENUM_LINE_STYLE style = STYLE_SOLID, // line style
                 const int             width = 1,         // line width
                 const bool            back = true,      // in the background
                 const bool            selection = false,  // highlight to move
                 const bool            ray_right = false, // line's continuation to the right
                 const bool            hidden = true,     // hidden in the object list
                 const long            z_order = 0)       // priority for mouse click
{
//--- reset the error value
   ResetLastError();
//--- create a trend line by the given coordinates
   if(!ObjectCreate(chart_ID, name, OBJ_TREND, sub_window, time1, price1, time2, price2)) {
/*      Print(__FUNCTION__,
            ": failed to create a trend line! Error code = ",GetLastError());*/
      ObjectMove(chart_ID, name, 0, time1, price1);
      ObjectMove(chart_ID, name, 0, time1, price1);
      return(false);
   }
//--- set line color
   ObjectSetInteger(chart_ID, name, OBJPROP_COLOR, clr);
//--- set line display style
   ObjectSetInteger(chart_ID, name, OBJPROP_STYLE, style);
//--- set line width
   ObjectSetInteger(chart_ID, name, OBJPROP_WIDTH, width);
//--- display in the foreground (false) or background (true)
   ObjectSetInteger(chart_ID, name, OBJPROP_BACK, back);
//--- enable (true) or disable (false) the mode of moving the line by mouse
//--- when creating a graphical object using ObjectCreate function, the object cannot be
//--- highlighted and moved by default. Inside this method, selection parameter
//--- is true by default making it possible to highlight and move the object
   ObjectSetInteger(chart_ID, name, OBJPROP_SELECTABLE, selection);
   ObjectSetInteger(chart_ID, name, OBJPROP_SELECTED, selection);
//--- enable (true) or disable (false) the mode of continuation of the line's display to the right
   ObjectSetInteger(chart_ID, name, OBJPROP_RAY_RIGHT, ray_right);
//--- hide (true) or display (false) graphical object name in the object list
   ObjectSetInteger(chart_ID, name, OBJPROP_HIDDEN, hidden);
//--- set the priority for receiving the event of a mouse click in the chart
   ObjectSetInteger(chart_ID, name, OBJPROP_ZORDER, z_order);
//--- successful execution
   return(true);
}
2.TrendCreateで×マークを表示
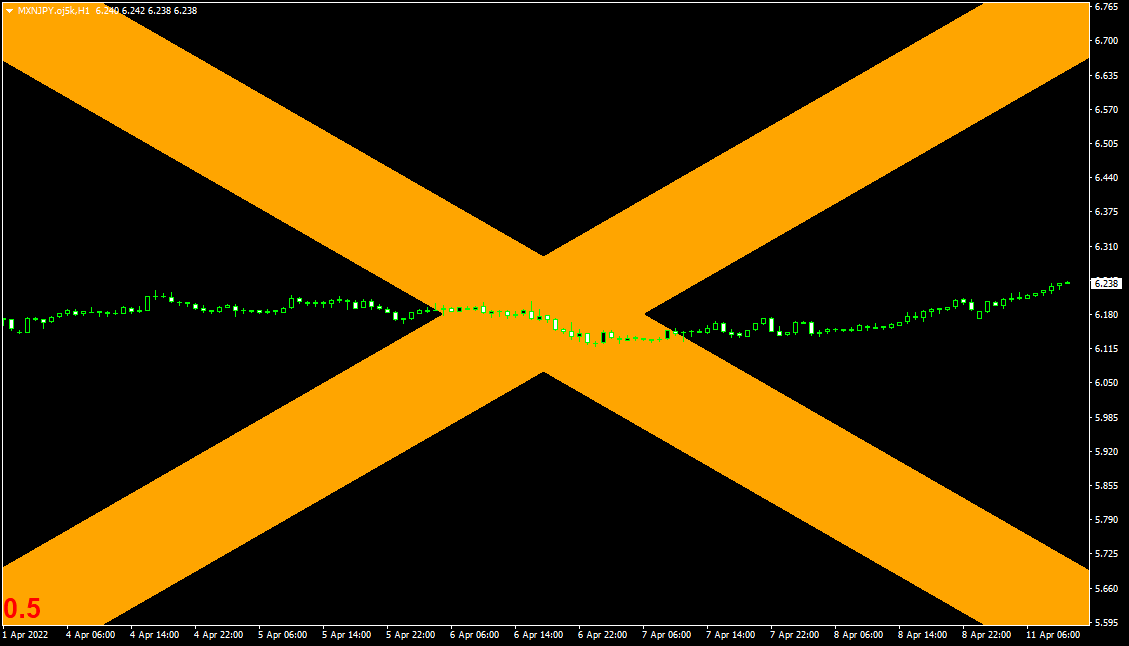
設定したTrendCreateは、LabelCreate同様にDrawX()内で実行します。まずは右下がりのトレンドラインを描きます。パラメーターについては、チャートIDを「0」、名前を「PREFIX + “X0″」、ウィンドウを「0」、左の時間を「timeL」、その価格を「max」、右の時間を「timeR」、その価格を「min」、色を定義した「clrX」、スタイルを実線の「STYLE_SOLID」、太さを「100」とします。×マークにしたいので、同じように右上がりのトレンドラインもTrendCreateで描画しましょう。
TrendCreate(0, PREFIX + "X0", 0, timeL, max, timeR, min, clrX, STYLE_SOLID, 100);
TrendCreate(0, PREFIX + "X1", 0, timeL, min, timeR, max, clrX, STYLE_SOLID, 100);
これでコンパイルすると、チャートにオレンジの×マークが描かれることが分かります。

ただし、このままではチャートを移動させたり価格の表示範囲を拡大、縮小したりすると、その動きに×マークが追随しません。

チャートが変化したときにも同様の処理を行うように、OnChartEvent関数内に次のif文を追記しましょう。
if (id == CHARTEVENT_CHART_CHANGE) DrawX();
こうすることで、チャートを変化させても×マークの表示が追随するようになります。
3.ソースコード
今回、作成したソースコードは下記の通りです。
//+------------------------------------------------------------------+
//|                                                    ATR_Judge.mq4 |
//|                        Copyright 2022, MetaQuotes Software Corp. |
//|                                             https://www.mql5.com |
//+------------------------------------------------------------------+
#property copyright "Copyright 2022, MetaQuotes Software Corp."
#property link      "https://www.mql5.com"
#property version   "1.00"
#property strict
#property indicator_chart_window

#define PREFIX MQLInfoString(MQL_PROGRAM_NAME) + "_"
//--- input parameters
input ENUM_TIMEFRAMES TF = PERIOD_M5; // 時間足
input int      PERIOD = 14;           // 期間
input double   LEVEL = 1.5;           // 許容値
//+------------------------------------------------------------------+
//| Custom indicator initialization function                         |
//+------------------------------------------------------------------+
int OnInit()
{
//--- indicator buffers mapping

//---
   return(INIT_SUCCEEDED);
}
//+------------------------------------------------------------------+
//| Custom indicator deinitialization function                         |
//+------------------------------------------------------------------+
void OnDeinit(const int reason)
{
   ObjectsDeleteAll(0, PREFIX);
}
//+------------------------------------------------------------------+
//| Custom indicator iteration function                              |
//+------------------------------------------------------------------+
int OnCalculate(const int rates_total,
                const int prev_calculated,
                const datetime &time[],
                const double &open[],
                const double &high[],
                const double &low[],
                const double &close[],
                const long &tick_volume[],
                const long &volume[],
                const int &spread[])
{
//---
   DrawX();
//--- return value of prev_calculated for next call
   return(rates_total);
}
//+------------------------------------------------------------------+
//| ChartEvent function                                              |
//+------------------------------------------------------------------+
void OnChartEvent(const int id,
                  const long &lparam,
                  const double &dparam,
                  const string &sparam)
{
//---
   if (id == CHARTEVENT_CHART_CHANGE) DrawX();
}
//+------------------------------------------------------------------+
//| Draw function                                              |
//+------------------------------------------------------------------+
void DrawX()
{
   double atr = iATR(NULL, TF, PERIOD, 1) / _Point / 10;
   bool small = atr < LEVEL;
   color clrATR = small ? clrRed : clrWhite;

   LabelCreate(0, PREFIX + "ATR", 0, 0, 0, CORNER_LEFT_LOWER, DoubleToString(atr, 1), "Arial Bold", 20, clrATR, 0, ANCHOR_LEFT_LOWER);

   double max = ChartGetDouble(0, CHART_PRICE_MAX);
   double min = ChartGetDouble(0, CHART_PRICE_MIN);
   int barL = (int)ChartGetInteger(0, CHART_FIRST_VISIBLE_BAR);
   int barR = barL - (int)ChartGetInteger(0, CHART_WIDTH_IN_BARS);
   datetime timeL = Time[barL];
   datetime timeR = barR >= 0 ? Time[barR] : Time[0] - barR * PeriodSeconds();
   color clrX = small ? clrOrange : clrNONE;

   TrendCreate(0, PREFIX + "X0", 0, timeL, max, timeR, min, clrX, STYLE_SOLID, 100);
   TrendCreate(0, PREFIX + "X1", 0, timeL, min, timeR, max, clrX, STYLE_SOLID, 100);
}
//+------------------------------------------------------------------+
//| Create a text label                                              |
//+------------------------------------------------------------------+
bool LabelCreate(const long              chart_ID = 0,             // chart's ID
                 const string            name = "Label",           // label name
                 const int               sub_window = 0,           // subwindow index
                 const int               x = 0,                    // X coordinate
                 const int               y = 0,                    // Y coordinate
                 const ENUM_BASE_CORNER  corner = CORNER_LEFT_UPPER, // chart corner for anchoring
                 const string            text = "Label",           // text
                 const string            font = "Arial",           // font
                 const int               font_size = 10,           // font size
                 const color             clr = clrRed,             // color
                 const double            angle = 0.0,              // text slope
                 const ENUM_ANCHOR_POINT anchor = ANCHOR_LEFT_UPPER, // anchor type
                 const bool              back = false,             // in the background
                 const bool              selection = false,        // highlight to move
                 const bool              hidden = true,            // hidden in the object list
                 const long              z_order = 0)              // priority for mouse click
{
//--- reset the error value
   ResetLastError();
//--- create a text label
   if(!ObjectCreate(chart_ID, name, OBJ_LABEL, sub_window, 0, 0)) {
      /*      Print(__FUNCTION__,
                  ": failed to create text label! Error code = ",GetLastError());*/
      ObjectSetString(chart_ID, name, OBJPROP_TEXT, text);
      ObjectSetInteger(chart_ID, name, OBJPROP_COLOR, clr);
      return(false);
   }
//--- set label coordinates
   ObjectSetInteger(chart_ID, name, OBJPROP_XDISTANCE, x);
   ObjectSetInteger(chart_ID, name, OBJPROP_YDISTANCE, y);
//--- set the chart's corner, relative to which point coordinates are defined
   ObjectSetInteger(chart_ID, name, OBJPROP_CORNER, corner);
//--- set the text
   ObjectSetString(chart_ID, name, OBJPROP_TEXT, text);
//--- set text font
   ObjectSetString(chart_ID, name, OBJPROP_FONT, font);
//--- set font size
   ObjectSetInteger(chart_ID, name, OBJPROP_FONTSIZE, font_size);
//--- set the slope angle of the text
   ObjectSetDouble(chart_ID, name, OBJPROP_ANGLE, angle);
//--- set anchor type
   ObjectSetInteger(chart_ID, name, OBJPROP_ANCHOR, anchor);
//--- set color
   ObjectSetInteger(chart_ID, name, OBJPROP_COLOR, clr);
//--- display in the foreground (false) or background (true)
   ObjectSetInteger(chart_ID, name, OBJPROP_BACK, back);
//--- enable (true) or disable (false) the mode of moving the label by mouse
   ObjectSetInteger(chart_ID, name, OBJPROP_SELECTABLE, selection);
   ObjectSetInteger(chart_ID, name, OBJPROP_SELECTED, selection);
//--- hide (true) or display (false) graphical object name in the object list
   ObjectSetInteger(chart_ID, name, OBJPROP_HIDDEN, hidden);
//--- set the priority for receiving the event of a mouse click in the chart
   ObjectSetInteger(chart_ID, name, OBJPROP_ZORDER, z_order);
//--- successful execution
   return(true);
}
//+------------------------------------------------------------------+
//| Create a trend line by the given coordinates                     |
//+------------------------------------------------------------------+
bool TrendCreate(const long            chart_ID = 0,      // chart's ID
                 const string          name = "TrendLine", // line name
                 const int             sub_window = 0,    // subwindow index
                 datetime              time1 = 0,         // first point time
                 double                price1 = 0,        // first point price
                 datetime              time2 = 0,         // second point time
                 double                price2 = 0,        // second point price
                 const color           clr = clrRed,      // line color
                 const ENUM_LINE_STYLE style = STYLE_SOLID, // line style
                 const int             width = 1,         // line width
                 const bool            back = true,      // in the background
                 const bool            selection = false,  // highlight to move
                 const bool            ray_right = false, // line's continuation to the right
                 const bool            hidden = true,     // hidden in the object list
                 const long            z_order = 0)       // priority for mouse click
{
//--- reset the error value
   ResetLastError();
//--- create a trend line by the given coordinates
   if(!ObjectCreate(chart_ID, name, OBJ_TREND, sub_window, time1, price1, time2, price2)) {
/*      Print(__FUNCTION__,
            ": failed to create a trend line! Error code = ",GetLastError());*/
      ObjectMove(chart_ID, name, 0, time1, price1);
      ObjectMove(chart_ID, name, 1, time2, price2);
      return(false);
   }
//--- set line color
   ObjectSetInteger(chart_ID, name, OBJPROP_COLOR, clr);
//--- set line display style
   ObjectSetInteger(chart_ID, name, OBJPROP_STYLE, style);
//--- set line width
   ObjectSetInteger(chart_ID, name, OBJPROP_WIDTH, width);
//--- display in the foreground (false) or background (true)
   ObjectSetInteger(chart_ID, name, OBJPROP_BACK, back);
//--- enable (true) or disable (false) the mode of moving the line by mouse
//--- when creating a graphical object using ObjectCreate function, the object cannot be
//--- highlighted and moved by default. Inside this method, selection parameter
//--- is true by default making it possible to highlight and move the object
   ObjectSetInteger(chart_ID, name, OBJPROP_SELECTABLE, selection);
   ObjectSetInteger(chart_ID, name, OBJPROP_SELECTED, selection);
//--- enable (true) or disable (false) the mode of continuation of the line's display to the right
   ObjectSetInteger(chart_ID, name, OBJPROP_RAY_RIGHT, ray_right);
//--- hide (true) or display (false) graphical object name in the object list
   ObjectSetInteger(chart_ID, name, OBJPROP_HIDDEN, hidden);
//--- set the priority for receiving the event of a mouse click in the chart
   ObjectSetInteger(chart_ID, name, OBJPROP_ZORDER, z_order);
//--- successful execution
   return(true);
}
本記事の監修者・HT FX
2013年にFXを開始し、その後専業トレーダーへ。2014年からMT4/MT5のカスタムインジケーターの開発に取り組む。ブログでは100本を超えるインジケーターを無料公開。投資スタイルは自作の秒足インジケーターを利用したスキャルピング。
EA(自動売買)を学びたい方へオススメコンテンツ

OANDAではEA(自動売買)を稼働するプラットフォームMT4/MT5の基本的な使い方について、画像や動画付きで詳しく解説しています。MT4/MT5のインストールからEAの設定方法までを詳しく解説しているので、初心者の方でもスムーズにEA運用を始めることが可能です。またOANDAの口座をお持ちであれば、独自開発したオリジナルインジケーターを無料で利用することもできます。EA運用をお考えであれば、ぜひ口座開設をご検討ください。
本ホームページに掲載されている事項は、投資判断の参考となる情報の提供を目的としたものであり、投資の勧誘を目的としたものではありません。投資方針、投資タイミング等は、ご自身の責任において判断してください。本サービスの情報に基づいて行った取引のいかなる損失についても、当社は一切の責を負いかねますのでご了承ください。また、当社は、当該情報の正確性および完全性を保証または約束するものでなく、今後、予告なしに内容を変更または廃止する場合があります。なお、当該情報の欠落・誤謬等につきましてもその責を負いかねますのでご了承ください。